Domains
A domain is a collection of subjects that are related to each other. Domains are the top-level building blocks of a graph, and the arrows between them (domain relationships) form the graph’s overall structure.
Creating a domain
Section titled “Creating a domain”Open a graph’s Domains tab (the default tab) and click “New Domain”. Give it a name, and optionally pick a style, a color used to distinguish the domain in the graph preview.
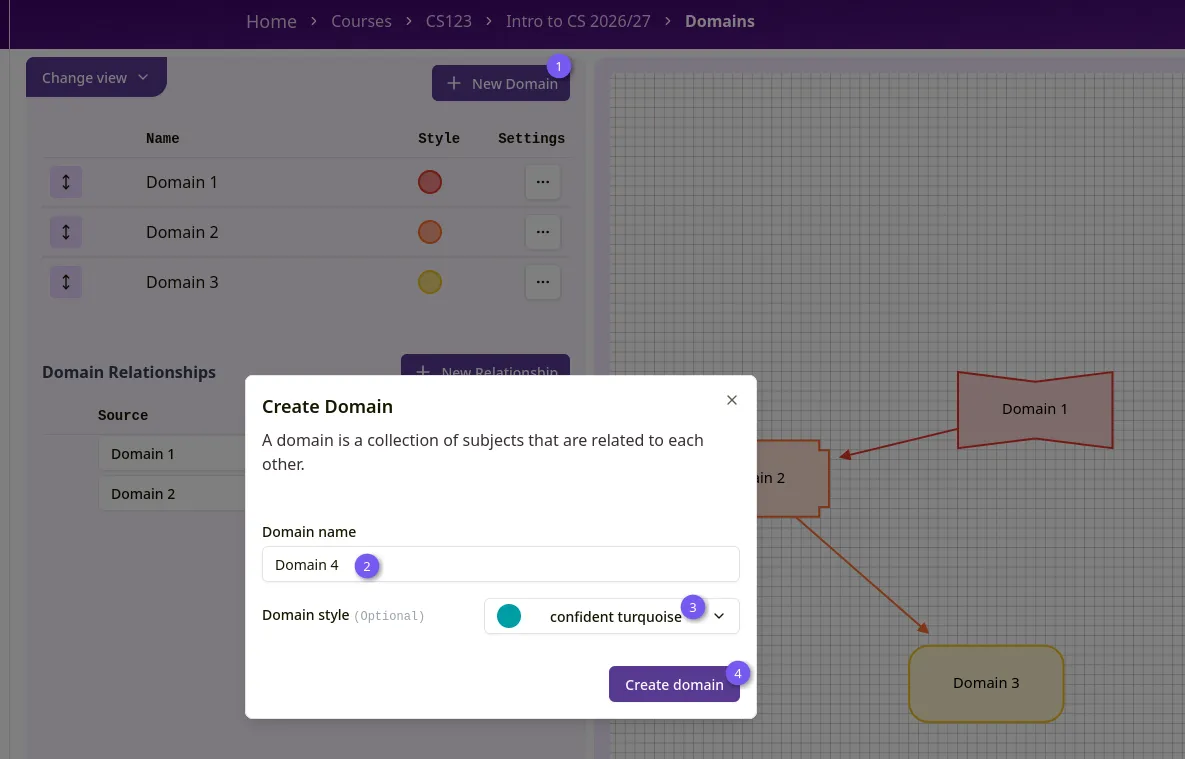 Figure 1: Create domain
New domains appear in a table, showing their name, style, and any validation issues.
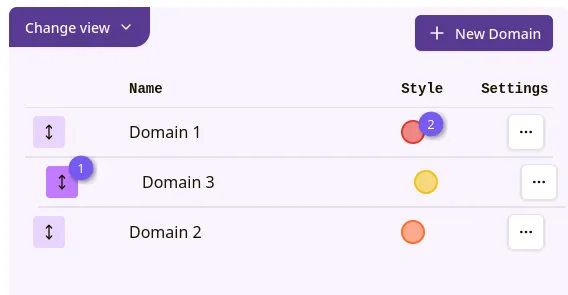 Figure 2: Domain table
You can drag rows (1) to reorder domains. You can also click a domain’s color patch (2) directly in the table to change its style without opening the edit dialog.
Editing or deleting a domain
Section titled “Editing or deleting a domain”Click the ellipsis menu on a domain’s row and choose “Edit” to rename it, change its style, or delete it.
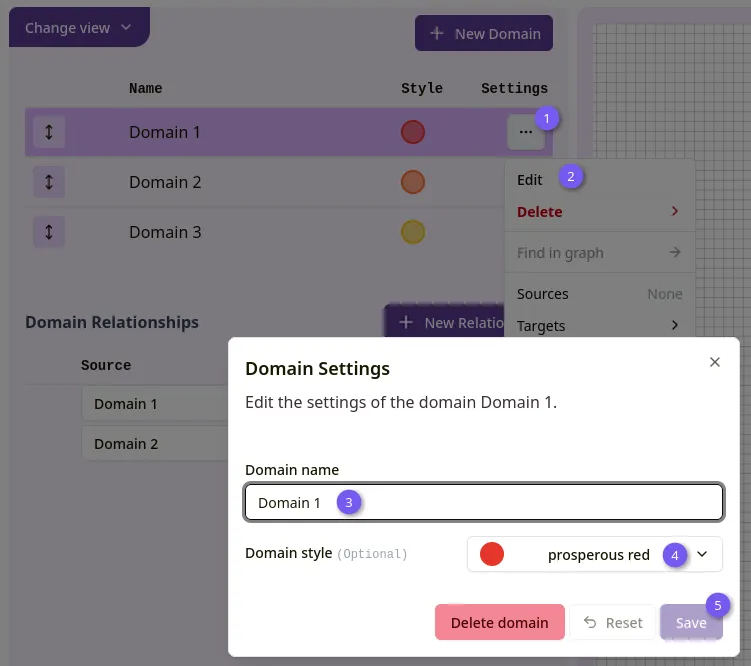 Figure 3: Edit domain
Deleting a domain also removes any domain relationships it’s part of and unlinks it from any subjects assigned to it. The confirmation dialog tells you exactly what will be affected before you confirm.
Domain relationships
Section titled “Domain relationships”Once a graph has at least one domain, a “Domain Relationships” section appears below the domain table. Click “New Relationship” and pick a source and target domain to connect them.
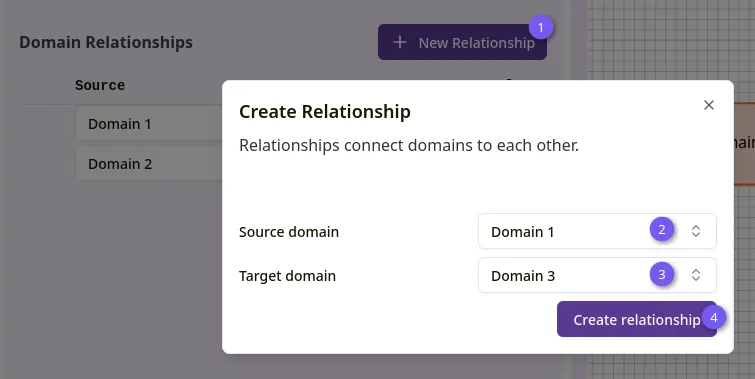 Figure 4: Create relationship
Relationships are listed in their own table. Click a relationship’s source or target cell to re-point it to a different domain, or use the trash icon to delete it.
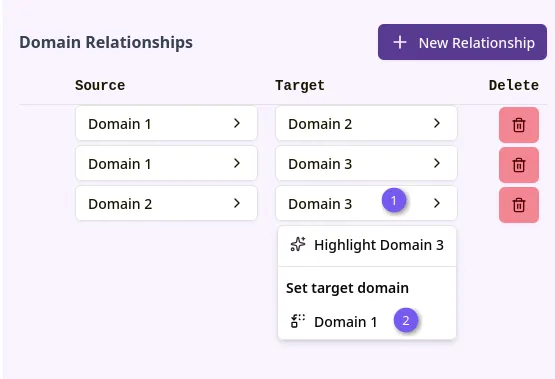 Figure 5: Relationship table