Graphs
A graph is a collection of domains, subjects and lectures, usually pertaining to the same field of study within a course.
Creating a graph
Section titled “Creating a graph”On the course overview page, click “New Graph” and give it a name.
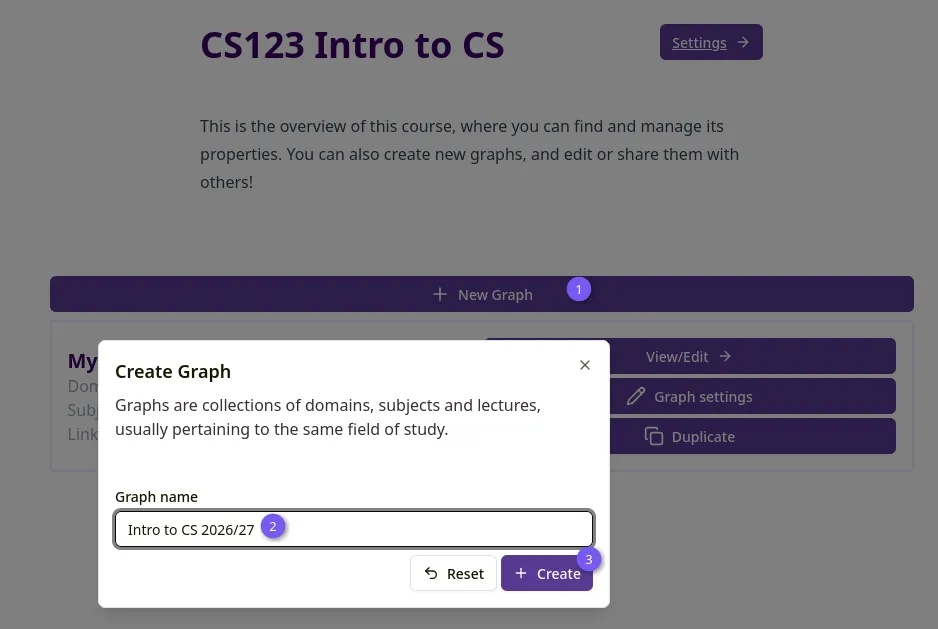 Figure 1: Create graph
The new graph appears as a card on the course overview page, showing its domain, subject and link counts. Click “View/Edit →” to open it. This takes you straight to the graph’s Domains tab.
Graph settings
Section titled “Graph settings”Click “Graph settings” on a graph’s card (or the settings button next to it in the course settings’ graph table) to rename or delete the graph.
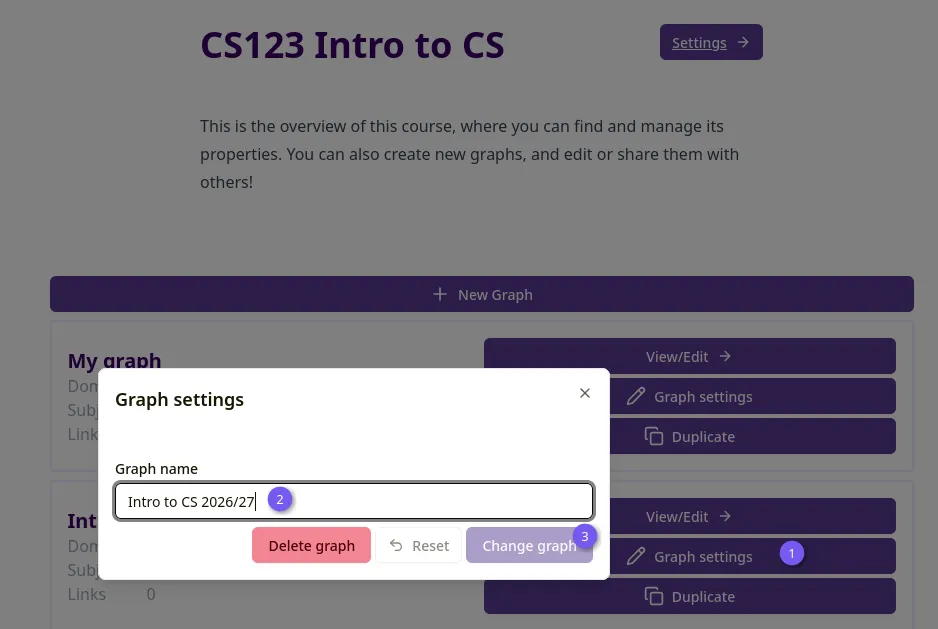 Figure 2: Graph settings
Duplicating a graph
Section titled “Duplicating a graph”Click “Duplicate” on a graph’s card to copy it, including all its domains, subjects and lectures, into any course or sandbox you have edit access to.
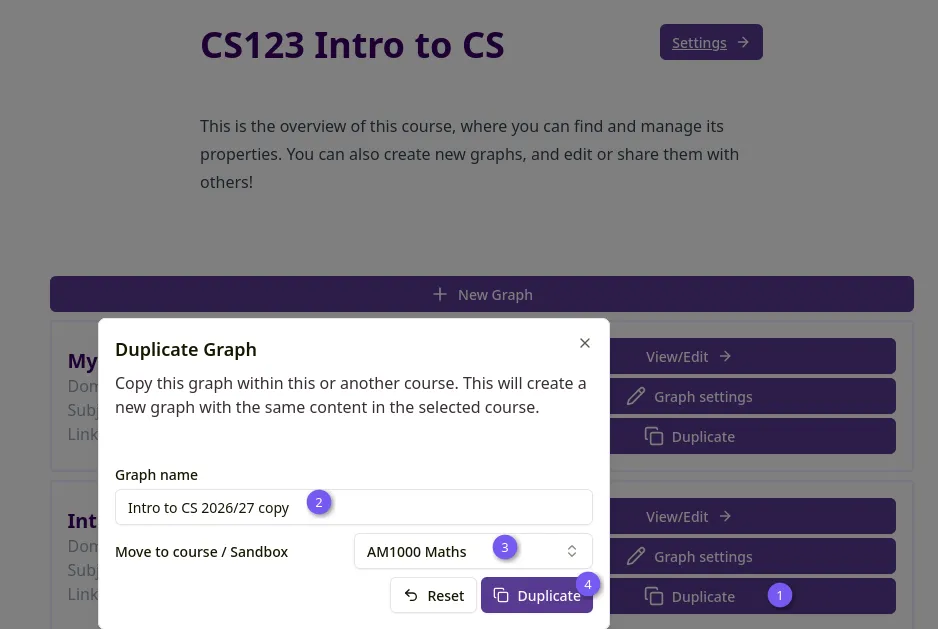 Figure 3: Duplicate graph
The new graph’s name defaults to “{original name} copy”. If a graph with the same name already exists in the destination, you’ll see a warning, but you can still proceed. This is a warning, not a hard rule against duplicate names.
Inside a graph
Section titled “Inside a graph”Once you’re editing a graph, use the “Change view” dropdown to switch between the Domains, Subjects and Lectures tabs. A live preview of the graph is shown alongside the editor and can be hidden with the “Show/Hide Preview” toggle.
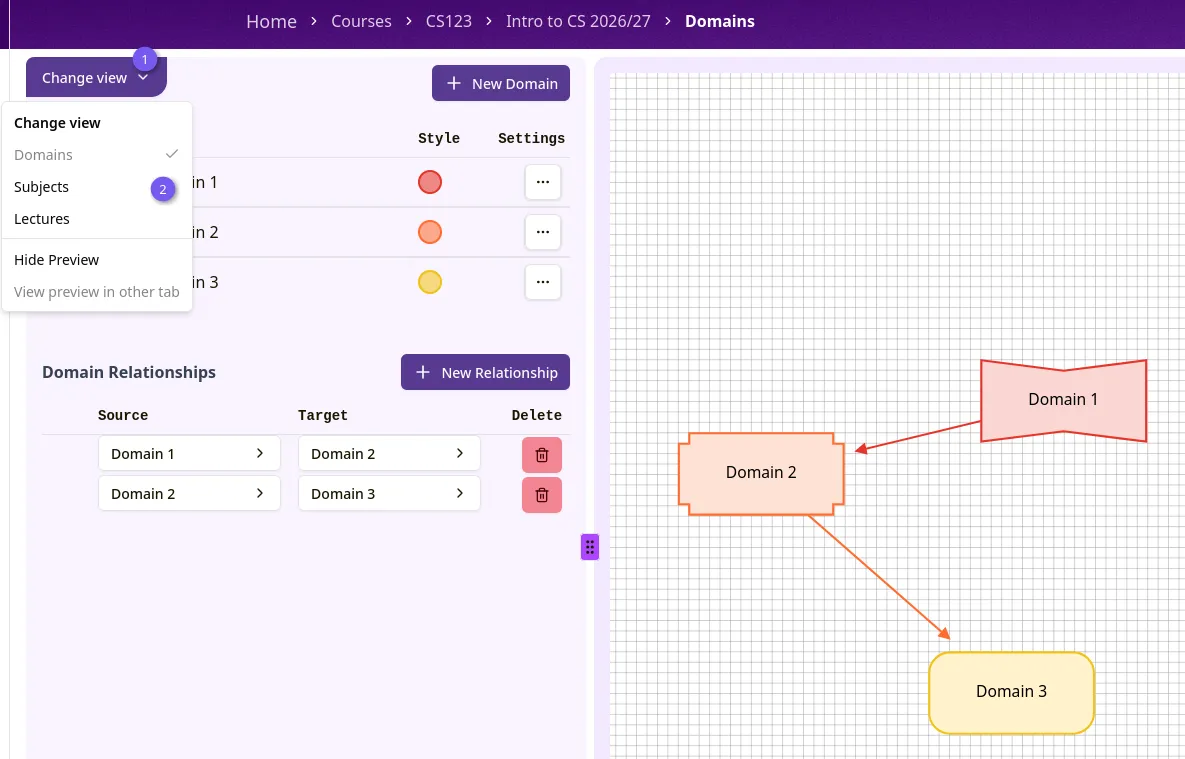 Figure 4: Change view
See the Domains, Subjects and Lectures pages for how to build out a graph’s content, and the Links page for sharing a finished graph.